


November 1, 2022
September 19, 2022
Debugging is equally as important as coding, like how carefully you write your code, you should treat debugging the same. Now we all know some easy debugging functions such as error_log and var_dump, but this article will introduce you to a more convenient and effective approach to debugging PHP code.
Enter Xdebug - a PHP extension that provides debugging and profiling capabilities, using DBGp debugging protocol.
With Xdebug, you no longer need to litter your code with error_log, print_r(), or var_dump()! That may sound cool already, but what even cooler is that Xdebug can also:
All in all, Xdebug saves you a bunch of time and also gives you a more comprehensive code review.
Prerequisite: PHP has been accurately installed
Here is how you can install Xdebug through PECL on macOS with Homebrew.
Prerequisite: Xcode's command line tools (run: xcode-select --install).
You should ignore any prompts to add "extension=xdebug.so" to php.ini — this will cause problems.
To install Xdebug on Windows, download the package from https://xdebug.org/download.Then browse to this page and follow its instruction: https://xdebug.org/wizard
Depending on your distribution, run one of the following commands:
Linux distributions might be providing an old and/or outdated version. If the package manager installs a version that is no longer supported (see Supported Versions), please install Xdebug with PECL, or from source instead.
Our teams at FABA often use Docker for our new projects. To install Xdebug on Docker, please clone this repository and follow the README file.
There is a popular VSCode extension for PHP called PHP Debug. You can find it in the extension window and install it.

After installation, reload the VSCode window. Now click on the debug console tab and click on Add Configuration.

Now, select PHP as the environment. VSCode will now add a launch.json file in the root directory.
Finally, add the runtimeExecutable property to the list after port:
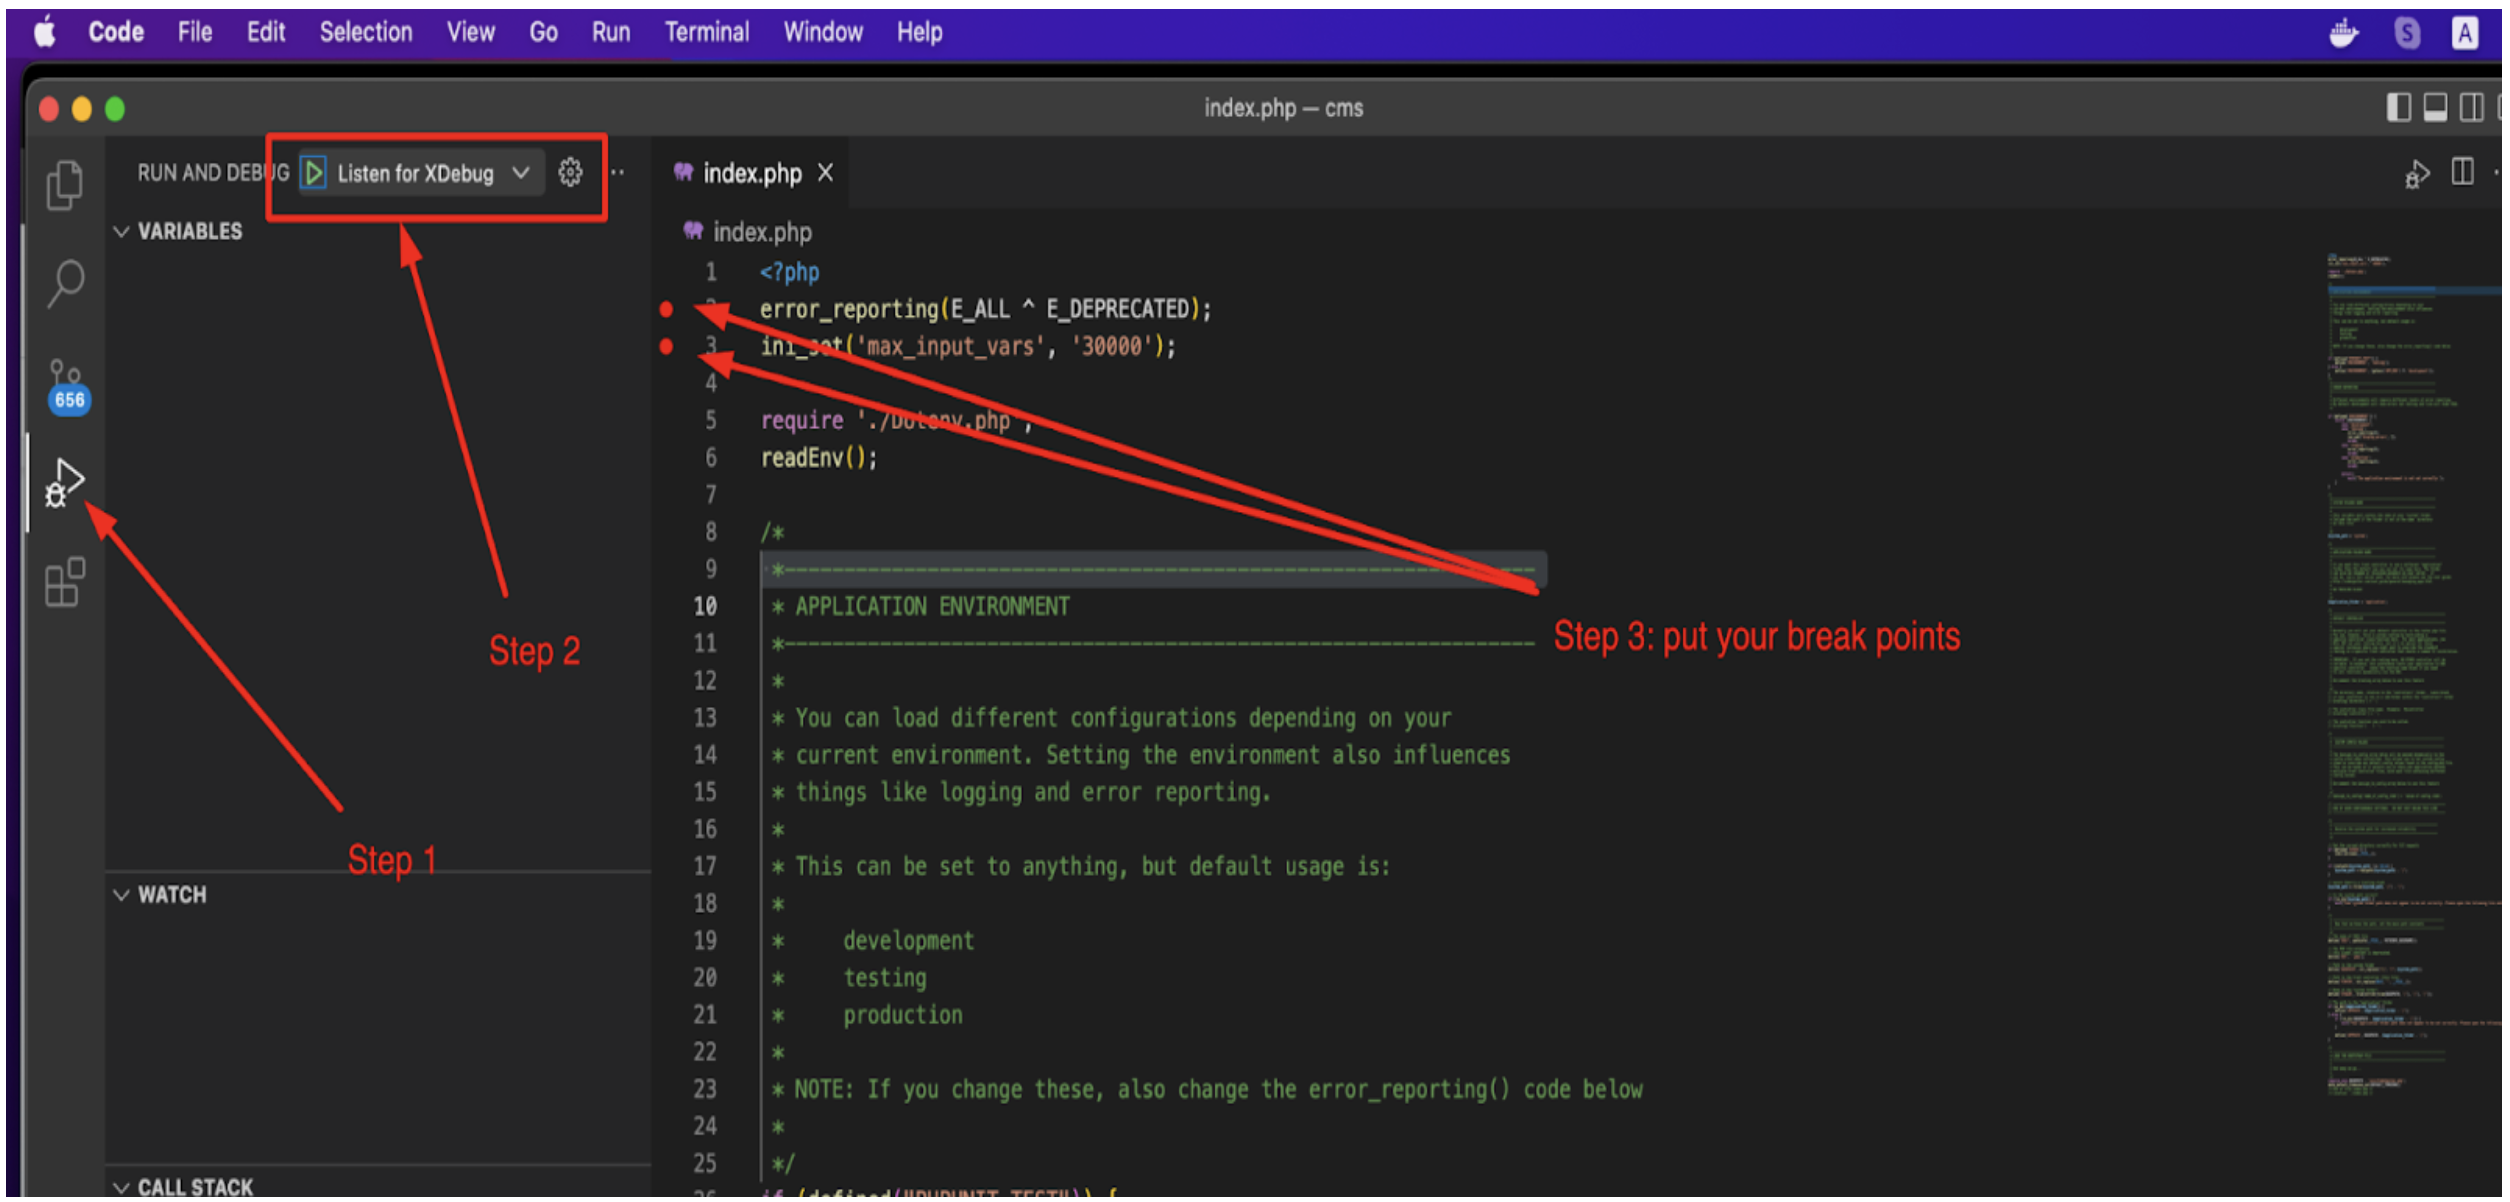
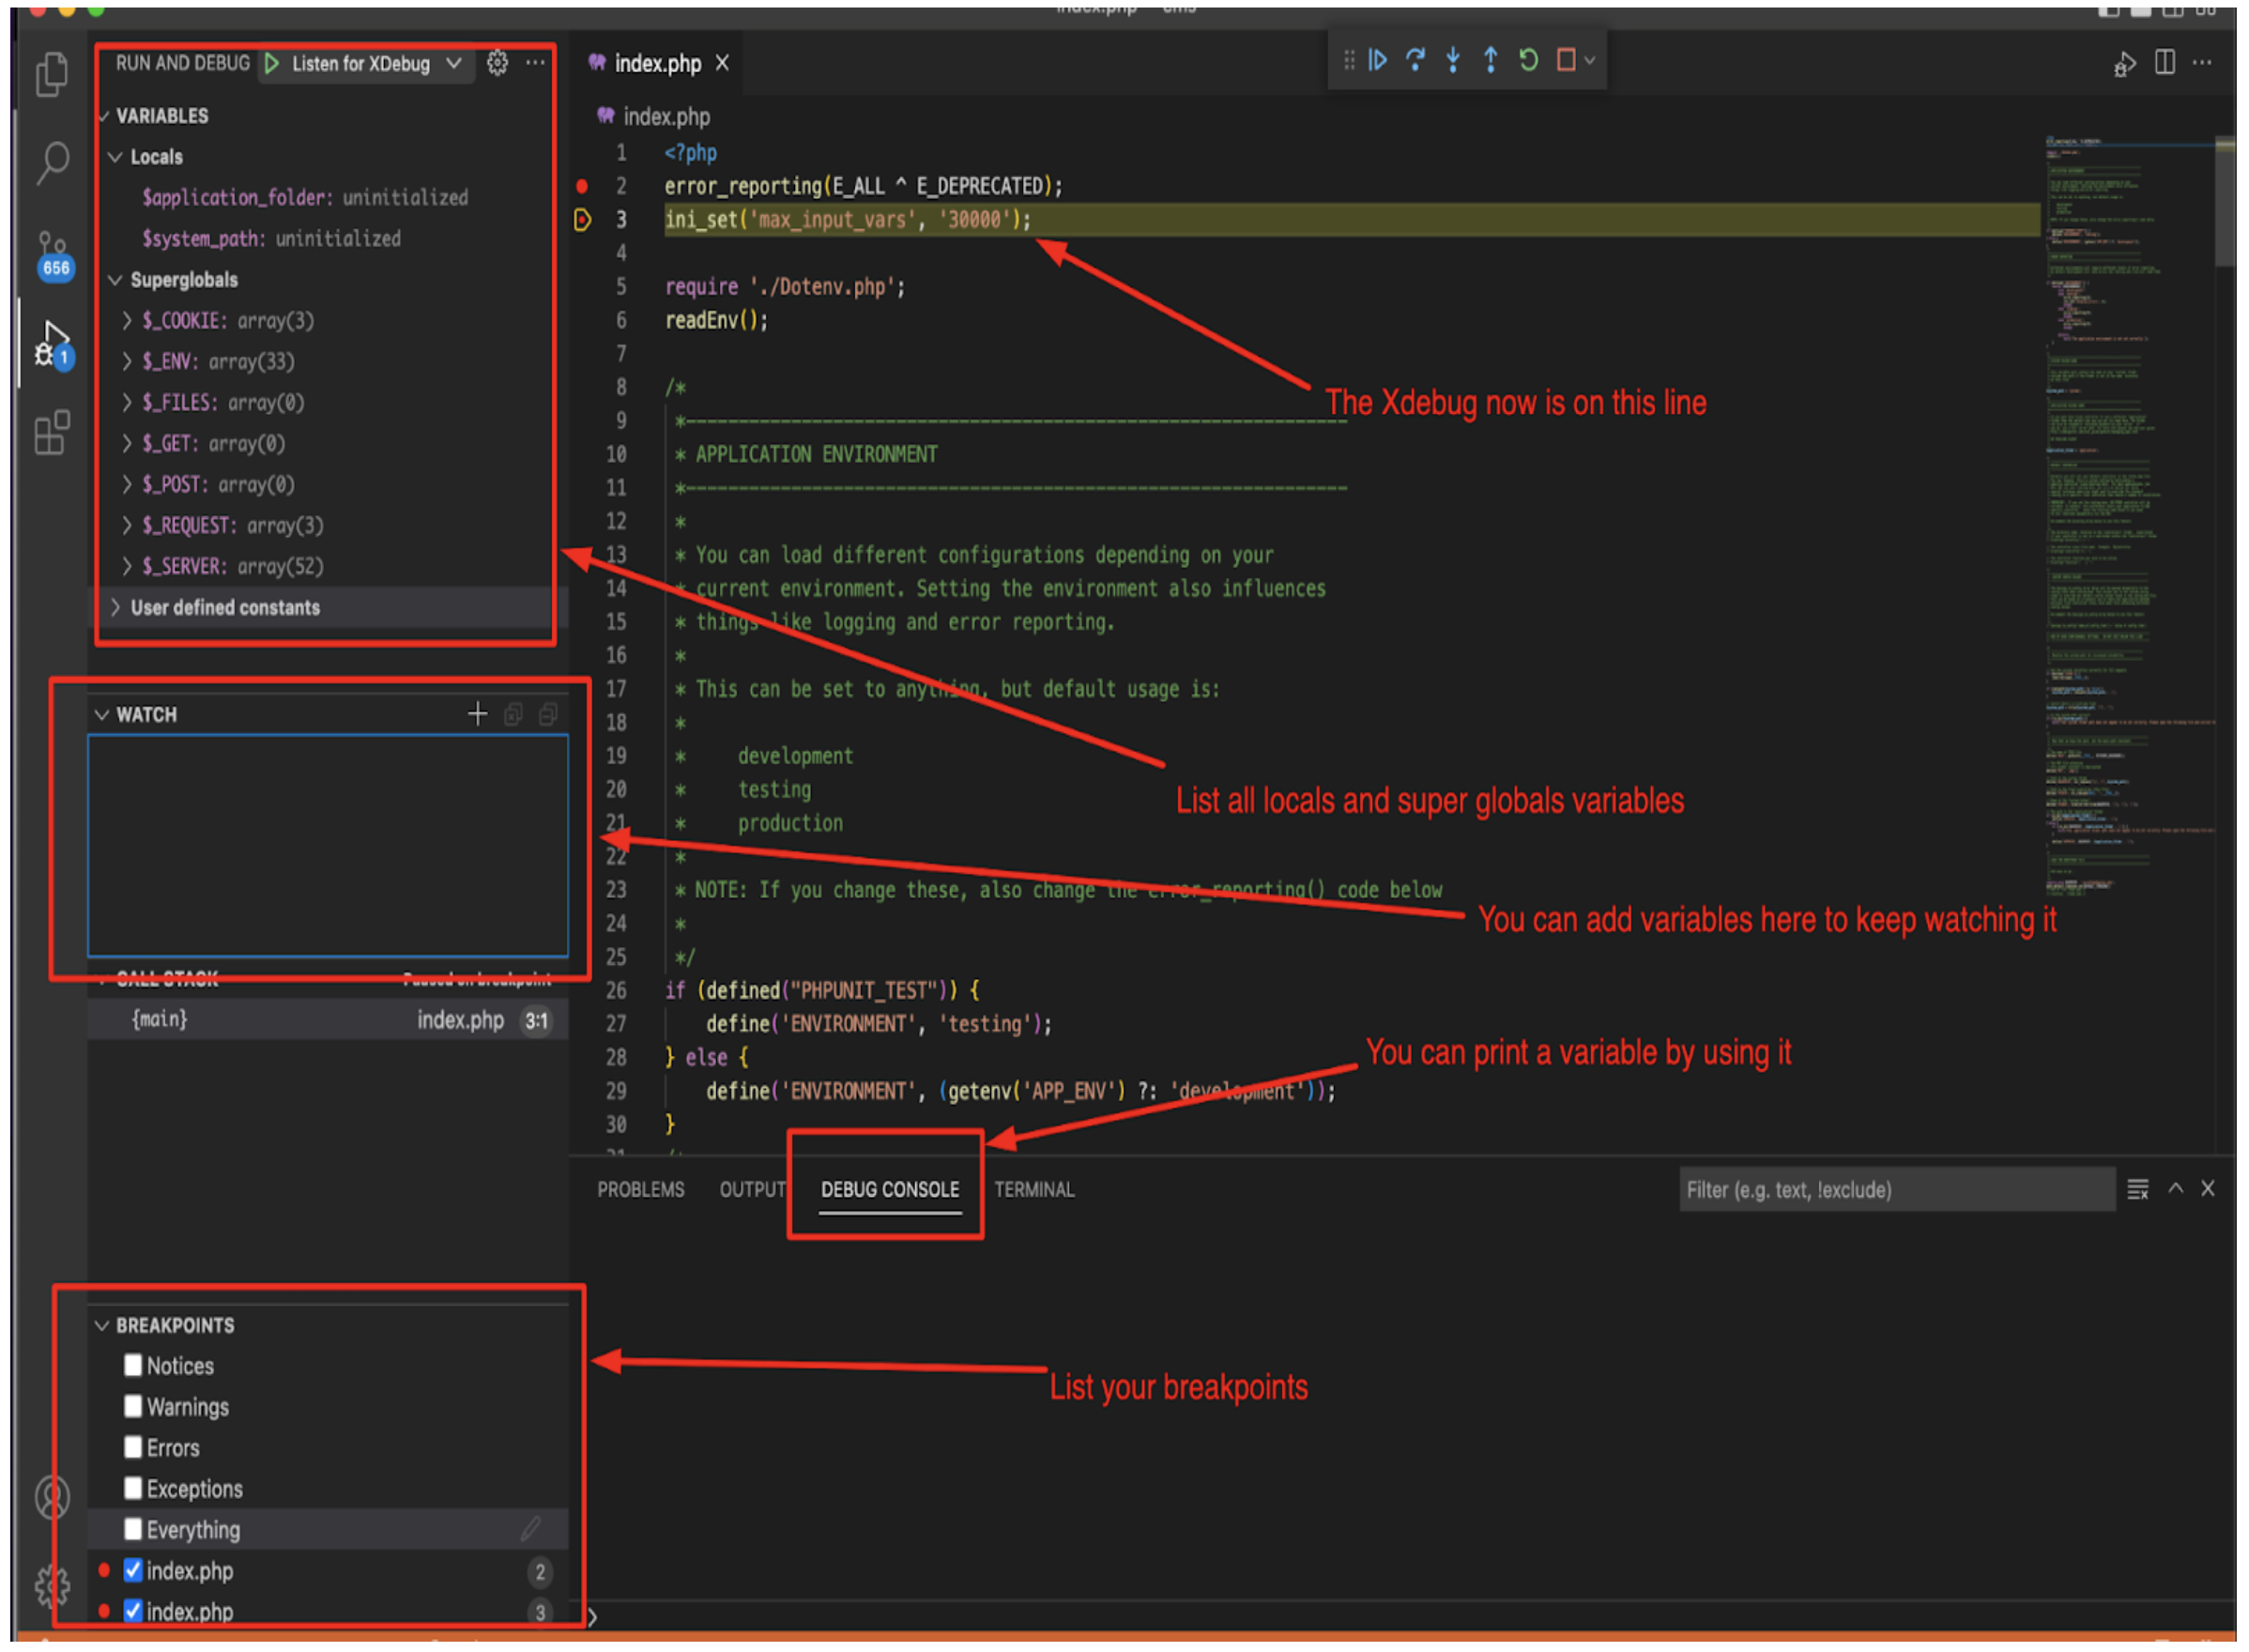
You will now see a few items in the window, through which you can select which logs Xdebugger will show, such as Notices, Warnings, Errors, and Exceptions.
As you navigate to the Debug Console section, you can see the details of errors and the debug execution buttons on top.
At this point, you can add breakpoints on the lines of code that you need to debug. Note that Xdebug will add the PHP debug script name with the line number on the bottom left section:
You can run the application in the browser, and then read the code line by line to see the errors and debug them properly.
Here are some shortcut function keys to quickly move through functions and lines of codes:
F5: Continue Debugging
F10: Step Over
F11: Step into
Shift + F11: Step out
Since PHPStorm already supports Xdebug, you only need to do some minor configs:

You can run the application in the browser, and then read the code line by line to see the errors and debug them properly.
Here are some shortcut functions keys:
F7: Step Into
F8: Step Over
F9: Continue Debugging

Debugging is an important aspect of coding; without it, you can not tell what went wrong with your code.
This article has introduced Xdebug and demonstrated how to install/debug with Xdebug and configure it in VSCode and PHPStorm. You can also integrate it into other IDEs.
The best practice is to set up your debugging environment before writing the code. If you are working on a complex application containing thousands of code lines, you will need a PHP debugger to find errors and warning signs better.


.png)